Track, Understand & Manage Brain Health
QuantActions – iOS & Android Apps

Industry:
Health Tech
What we did:
Strategy, iOS & Android App Design
My Role:
Workshop Facilitation, UX Research, User Testing, Wireframes & Prototyping, User Experience, Interface Design
Client website
Challenge:
QuantActions has developed a novel method for deriving insights about brain health solely from a user's smartphone interactions, including taps, swipes, and app location speed. This tap data contains valuable information about the user's brain status. The app's primary objective is to identify and track factors affecting brain health, addressing critical work-life issues such as stress, fatigue, and sleep problems that may lead to depression or burnout.
QuantActions gathers detailed information on individual performance, and our task was to translate this complex data into meaningful information. We designed an iOS and Android app and assisted with content creation.
Communicating the Power of the Algorithm
Onboarding is crucial for an app like QuantActions, as the product's value is best explained through the underlying algorithm. Repeated testing showed user skepticism, questioning the accuracy of the score and the app's ability to predict performance with minimal input. Addressing common concerns during onboarding was essential.

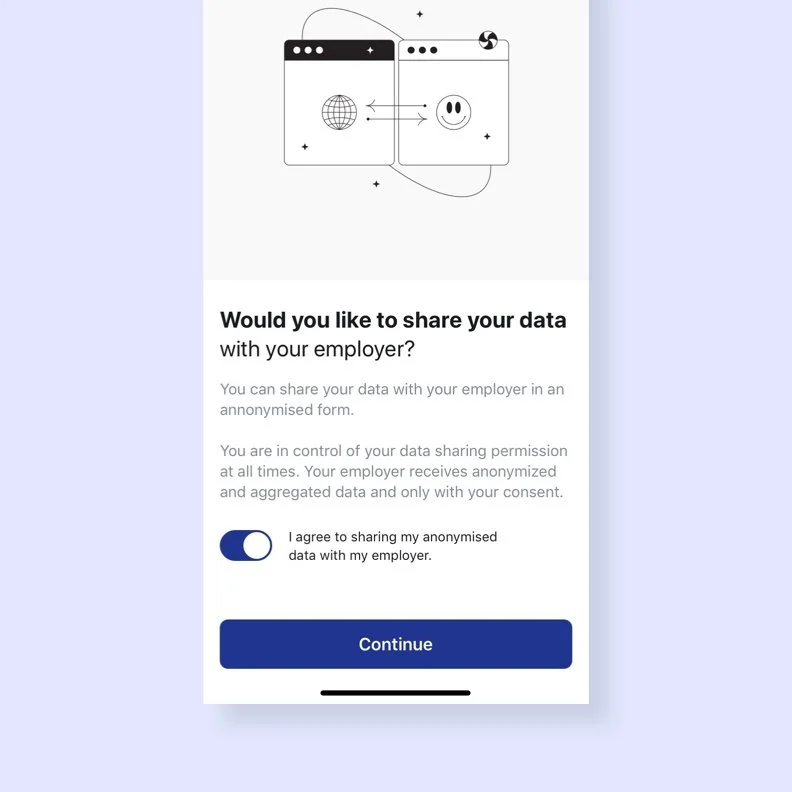
Privacy First
Onboarding extends beyond notifications, permissions, and profile setup; it's an opportunity to address privacy concerns and explain data-sharing details. Given the sensitive nature of health information, especially in a work setting, confidentiality is paramount. The message to convey is that all insights are for employees only, with employers receiving anonymized, aggregated data only with the employee's consent.

Overview at a Glance
The dashboard provides a quick overview of performance metrics, including cognitive fitness, energy level, sleep quality, and screen time, with additional parameters to be added soon. Passive background data collection initially leaves the dashboard empty, allowing us to build trust during the waiting period by presenting research on brain and mental health and explaining the preventive value of the app.
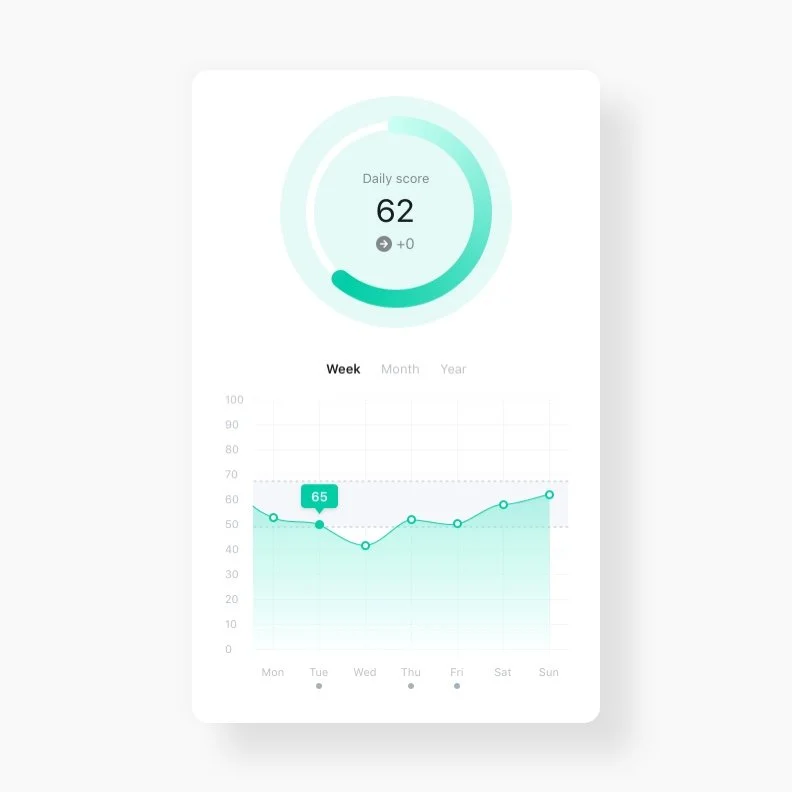
Keeping Score
Each metric is scored from 1 to 100, featuring trend information. Users are compared to the general population of the same sex and similar age. Emphasizing the importance of trends over daily scores, the app offers guidance on interpreting results and proactive health improvement.
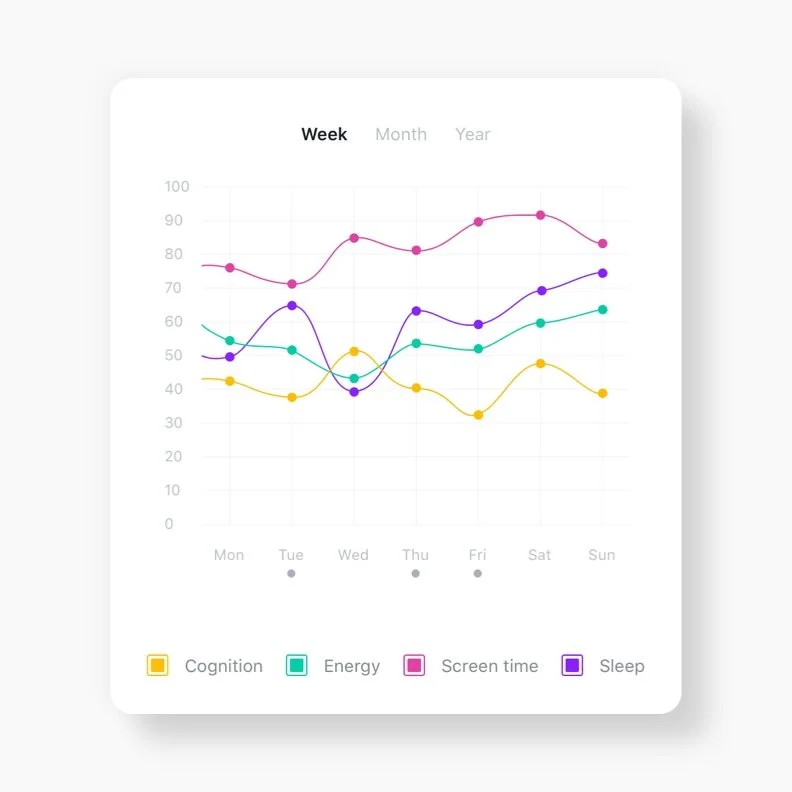
Compare Your Performance
Interactive graphs compare performance across multiple dimensions, enabling users to search for potential causalities in their professional or personal life. Metrics can influence each other, such as excessive screen time affecting sleep, and lack of sleep negatively impacting other parameters.

Keep Track with Journal Entries
What puts all the scores and trends in perspective is the journal. It was a critical feature — so we made it our priority. It is a log of daily entries of events and moods. We tried to account for the most common influencers like exercise, holiday, social circumstances, alcohol, and allow for full customisation. Sometimes you can’t quite pinpoint the exact cause of a low performance or mood. The journal is meant to shed light on the possible reasons for cognitive changes.
